


Councillors warn against complacency over Covid-19 risk map
Register for free to read more of the latest local news. It's easy and will only take a moment.

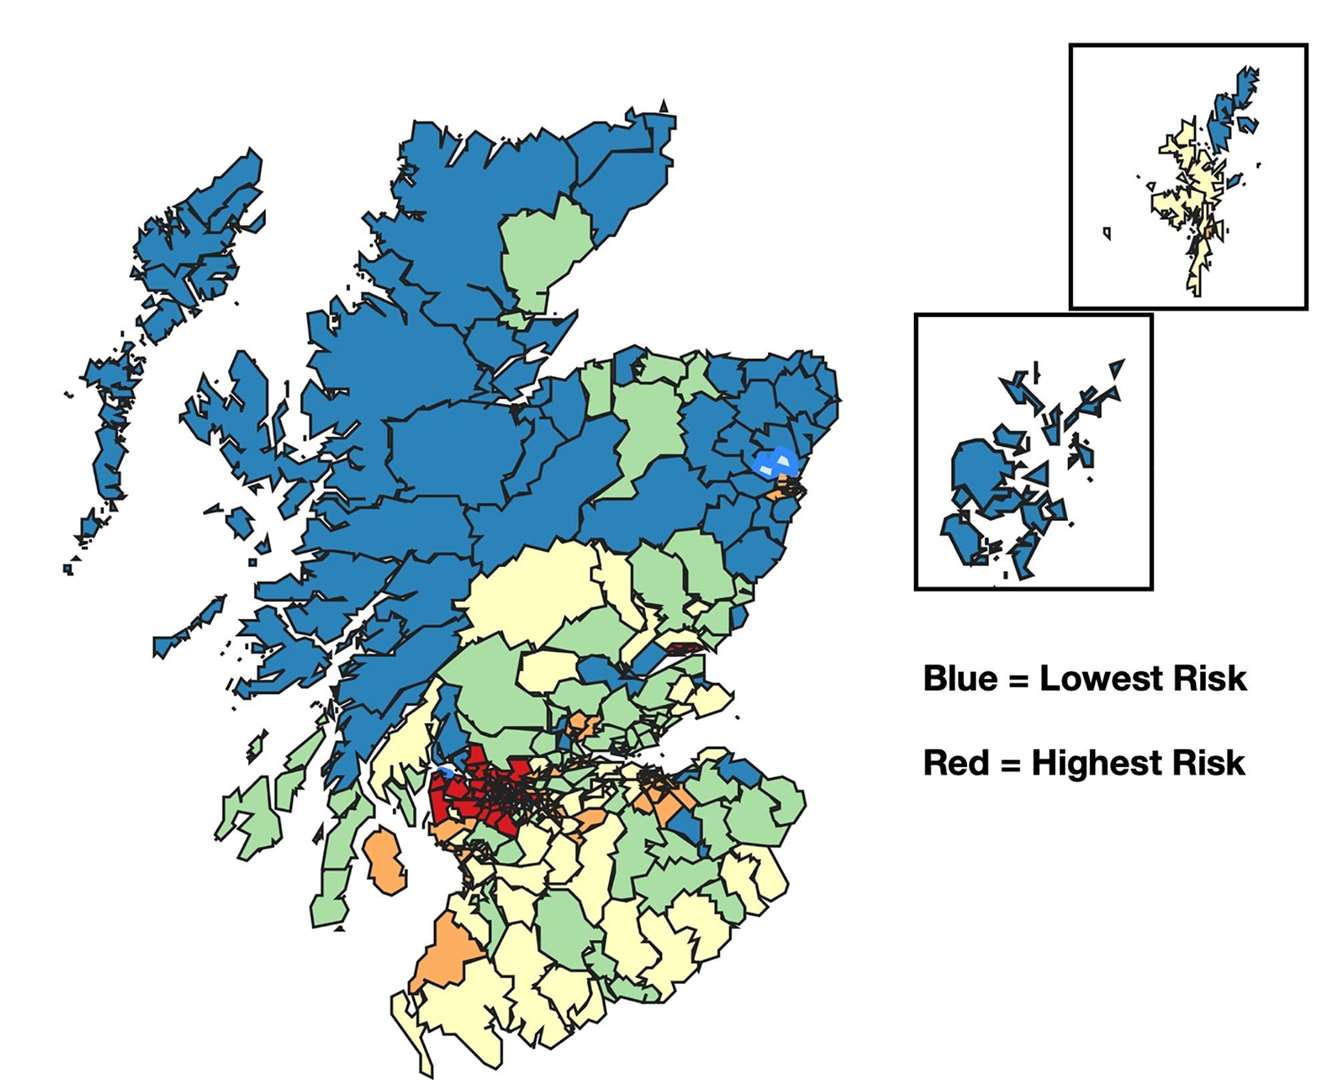
Caithness residents are being warned against any complacency after a new map showed the county in a low-risk category for Covid-19 exposure.
The freely accessible colour-coded map, compiled by a think tank of researchers and analysts, ranks Scotland's 354 local authority wards in order of risk.
The two Caithness council wards rank among the lowest, with Wick and East Caithness scoring 11.5 while Thurso and Northwest Caithness is given a figure of 16.6.
East Garioch council ward is the lowest at 0.3, while the highest rated is Inverclyde North at 112.7 on the scale of community risk exposure.
Councillor Nicola Sinclair, Wick and East Caithness, said: "It’s really encouraging to see Caithness categorised as low risk, but this just makes it all the more important that we continue to follow government and scientific advice regarding social distancing.
"At the beginning of lockdown the projections for Highland were grim, and this scenario has been avoided as a result of our very high local compliance with lockdown.
"We’ve all protected our community and the NHS by staying home, and as we gradually ease out of lockdown it has never been more important that we continue to be responsible and look after one another."

Councillor Matthew Reiss, Thurso and Northwest Caithness, agreed and said the county had responded "in an extraordinary manner" to the pandemic.
“Key themes for me are safety first, common sense and kindness, all of which have been so evident, and I am sure this will continue for as long as required,” he said.
"As the scientists learn more about how the virus can spread, the official advice will be updated and refined – and hopefully the overall situation will improve for everybody."
The map has been created by Scotianomics, of Glasgow, using existing data to calculate each area’s risk of exposure according to transmission probability and potential for fatalities.
The organisation says it could help guide Scottish Government policy on lifting lockdown restrictions on a phased geographical basis depending on the risk levels within individual communities.
The data used to compile the map includes population density, the number of older people or those with underlying health conditions, how many people use road and rail travel and access local health services and socio-economic factors such as the average incomes of residents.
In the executive summary notes for the map it states: "When the time is right, it should be possible for the Scottish Government to consider a staged reopening of the country, beginning firstly with low-risk areas."
There were, however, words of caution: "It must be pointed out that, although some areas are currently identified as low risk areas, this should not imply that people in those low-risk areas should now begin to unilaterally relax their compliance with social distancing/lockdown rules, as this could transform their communities into high-risk areas."

Gordon MacIntyre-Kemp, founding director of Scotianomics, said: “The public and business reaction to coronavirus is highly charged and often emotional.
"We believe this geographical breakdown can help the national response to provide clear analysis of existing data.
"What is evident is that, for a wide variety of reasons, the risks vary hugely in different communities across Scotland.
"In terms of both the economy and health and wellbeing, we believe it makes sense to ease the lockdown according to those regional differences in risk."
The research was conducted during April and has been submitted to the Scottish Government’s advisory group on economic recovery.
Currently, the research does not factor in actual infection rates or fatalities that may have been recorded in each area as these figures are not publicly available in sufficiently detailed form.
Scotianomics has pledged that it will update the online tracker as new datasets become available.
Mr MacIntyre-Kemp said: “We want to be absolutely clear – this is nothing to do with the number of cases in an area or how well people living in each area have observed the lockdown.
"It is not a map of Covid-19 cases across Scotland but of the areas most at risk of community infection.
“However, what it sets out very clearly is that the risks of transmission and the likelihood of fatalities within particular communities can be predicted with a high degree of confidence."
The online map can be viewed here.